Monthly Ground Truth on the Assets You Underwrite

Institutional-grade aerial capture on data centers, fabs, energy, and industrial sites

Order Now

No commitment. Order online in minutes.

FAA Part 107 Certified capture
24–72 hrs Delivery time
Upfront Fixed pricing

Challenges

Alternative data on physical assets bottoms out at the sensor. Satellite revisit is set by orbital mechanics rather than your research calendar, cloud cover deletes observations in exactly the months that matter, and at 30 to 50 cm you can confirm a building exists without being able to count transformers, read cooling configuration, measure a tank roof, or tell a commissioned hall from an empty shell. Thermal is coarse or unavailable, so utilization stays an inference rather than a measurement. Permits and channel checks arrive late and unevenly. The questions that actually move a position are the ones nobody can answer from 400 miles up: is the second phase energized, did the fab slip a quarter, how much product moved through the terminal last week.

Solutions 


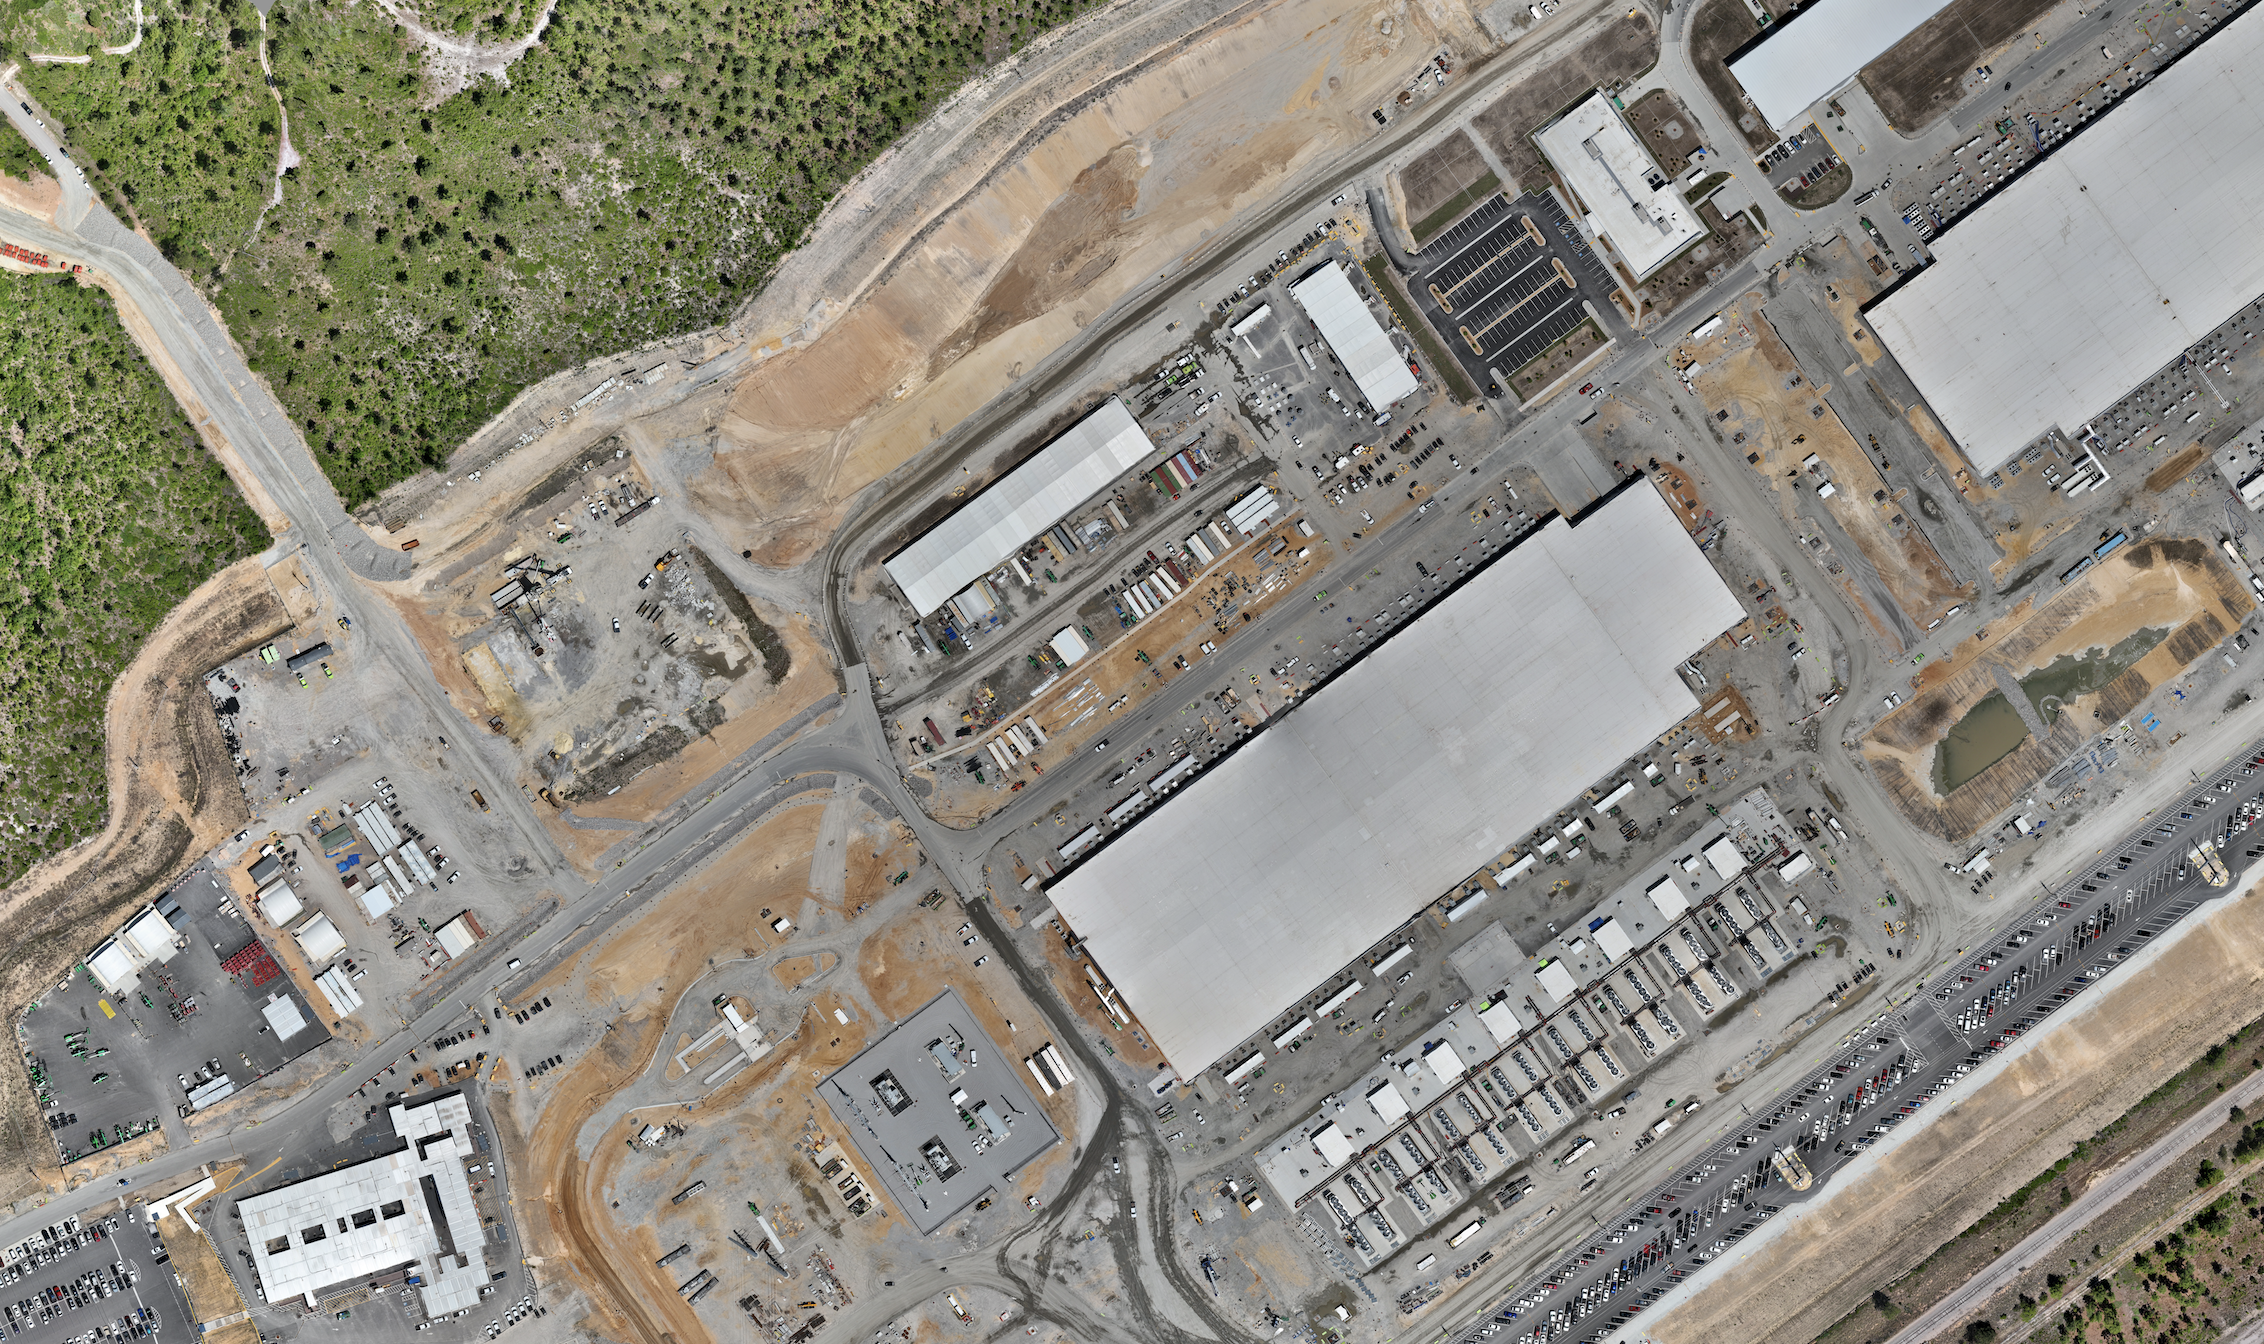
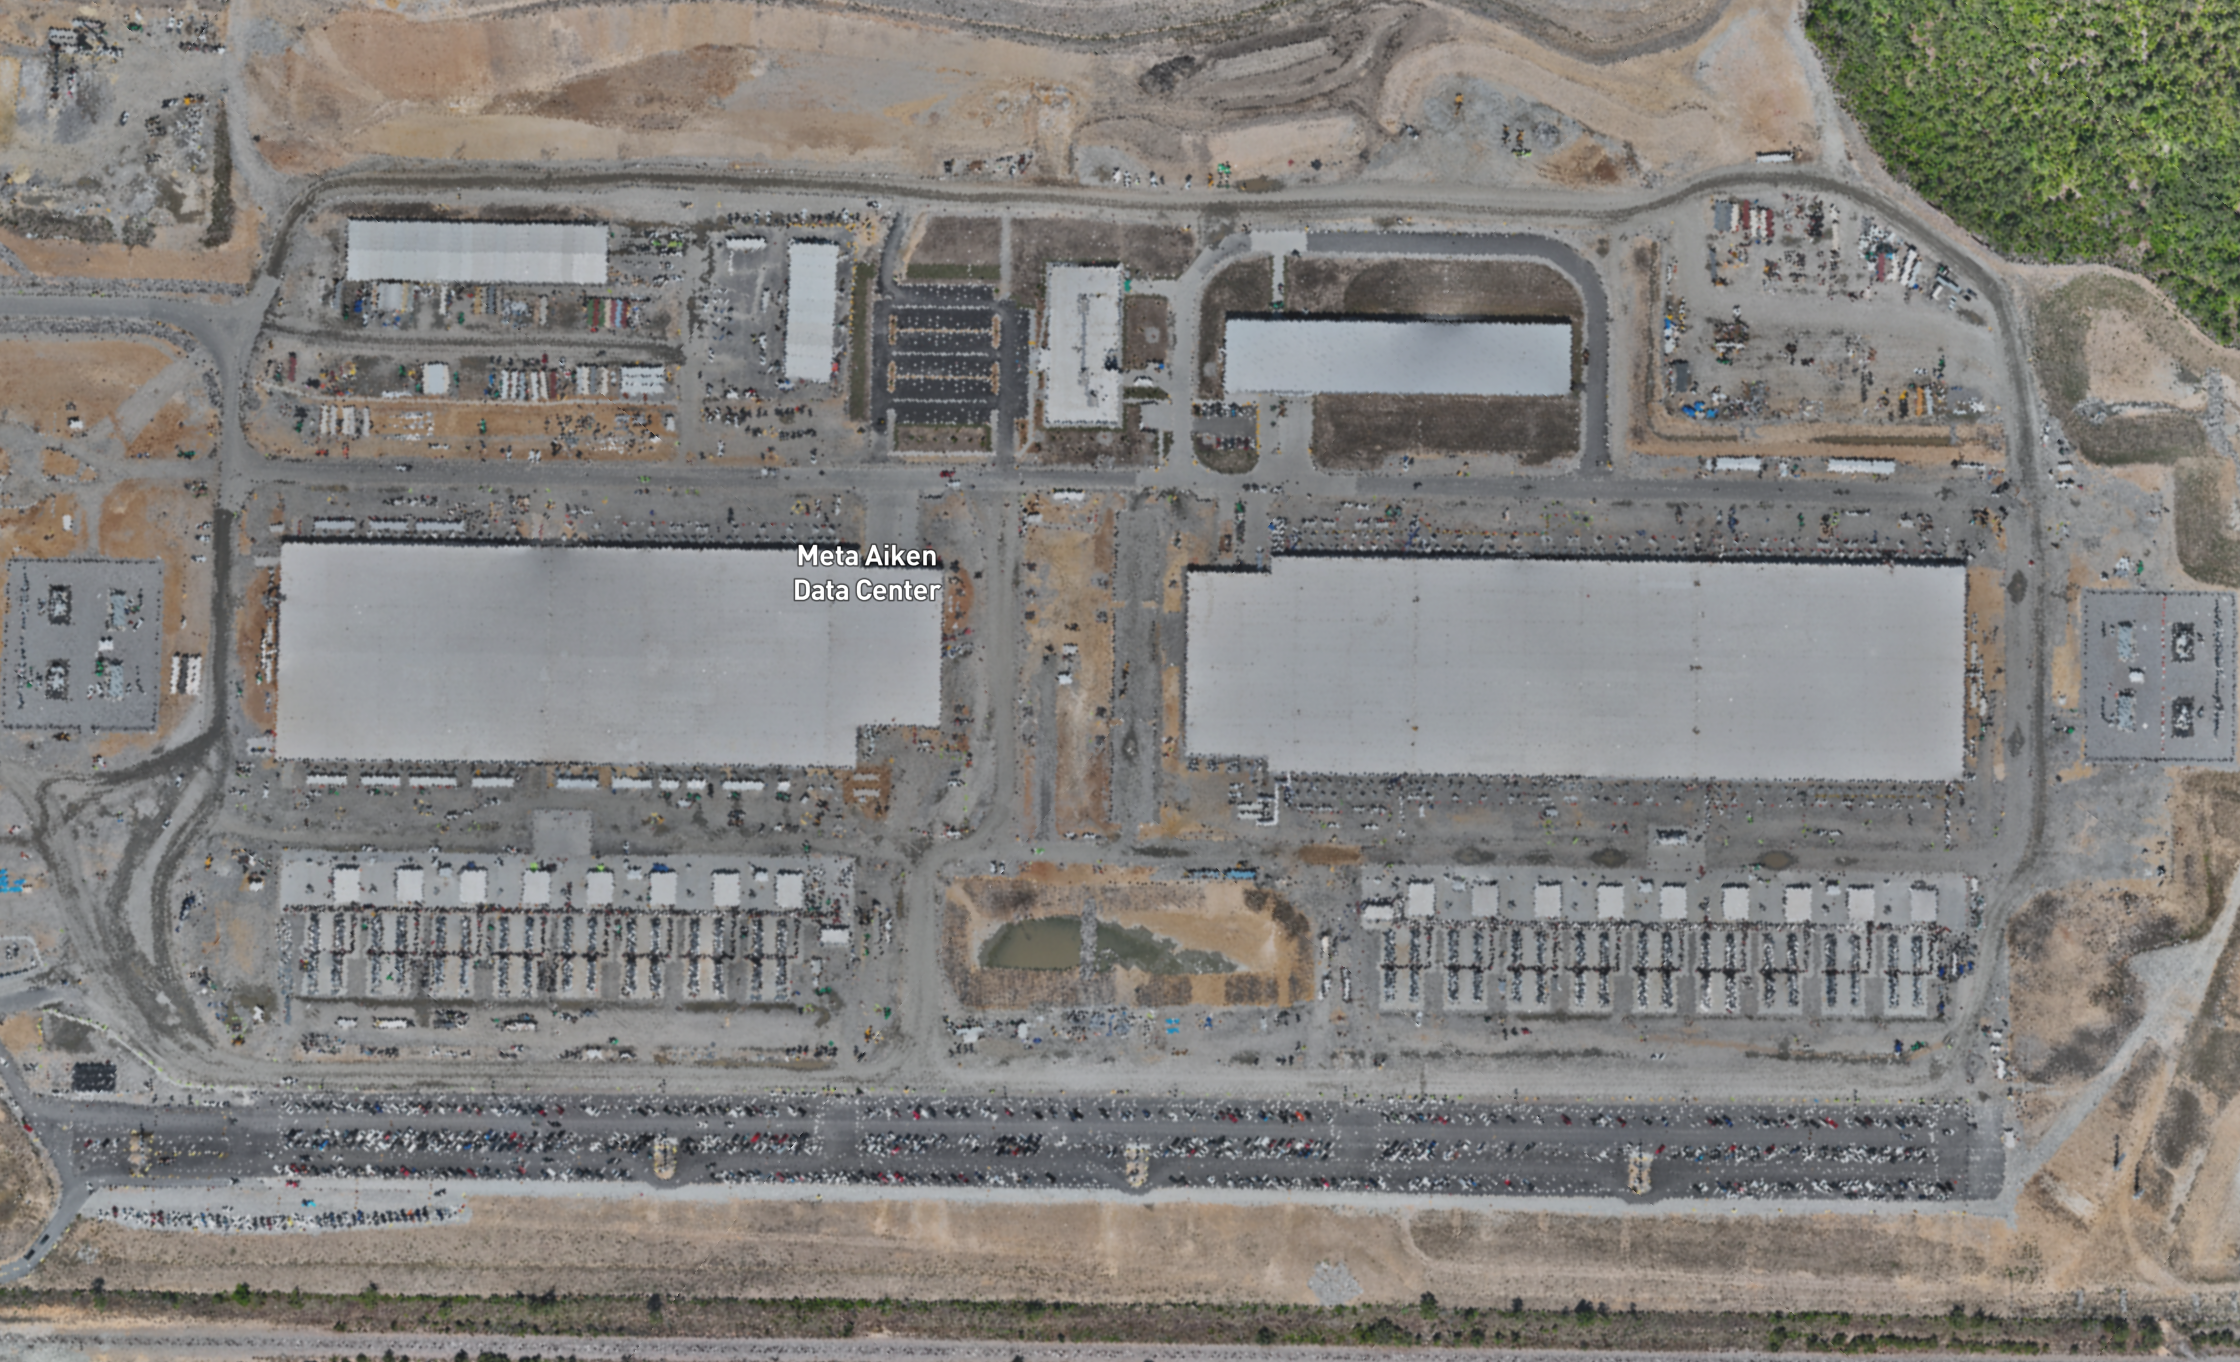
RAAD replaces inference with tasked capture. A certified pilot flies the asset at 2 cm ground sample distance, on a cadence you set, with radiometric thermal alongside RGB so heat differential becomes a measurable signal rather than a guess. The Data Center Readiness Index delivers this monthly across 83 US AI data centers above 50 MW, including crypto-to-AI conversion sites. The same network flies any site you name across 65 countries, under licensed authorization from public vantage, with documented provenance on every deliverable.

Questions satellite cannot answer

01

RGB puts your team on site in 24 hours

Ultra high resolution video and oblique imagery, not a nadir picture. Satellite looks straight down at a roof. A drone flies the elevation, so you see what the roof hides: whether steel is going up on phase two, whether the generator yard is populated or still a slab, whether the switchyard is strung, how many crews and how much equipment are on site this week. Oblique angles resolve vertical progress, and vertical progress is where construction schedules actually slip. When management tells the street a milestone is hit, you can look at it yourself within 24 hours of asking.
02

Thermal measures operational intensity

Whether an asset is built and whether an asset is running are different questions, and the second one is the one that moves numbers. Radiometric thermal at component level answers it directly. Point the sensor at chillers, substations, transformer banks, and generators and you get per-pixel temperature. An energized data center hall reads differently from one that is commissioned and idle, which reads differently again from an empty shell. The same logic carries across energy and industrial assets: a new train that is online carries a thermal signature that a train still in construction does not. Orbital thermal is tens of meters per pixel and tells you a site is warm. Component-level thermal tells you which units are working and how hard.

03

Persistence and granularity you control

Satellite revisit is dictated by orbit and erased by cloud. Drone capture is tasked. You choose the site, the date, the angle, and the cadence, and the aircraft flies under the weather. 2 cm ground sample distance on a schedule you set is what turns a sequence of observations into a time series you can model, rather than a scatter of whatever the sky allowed that quarter.
Questions this answers on a named site:
  1. Did phase two break ground on the date given on the call?
  2. Is the hall energized, commissioned and idle, or an empty shell?
  3. How many transformers and generators are installed versus foundations poured?
  4. Is the substation strung and the interconnect complete?
  5. Is new capacity running, or still in construction buildout?
  6. What changed here since last month, and by how much?

One tasking network, every asset class your thesis touches: Start with the AI buildout. Extend to any physical asset where the number you need is visible from the air.

01

AI data centers and campuses


Monthly RGB and radiometric thermal across 83 US sites above 50 MW, plus crypto-to-AI conversions. Hall commissioning, transformer and generator counts, cooling configuration, and heat signature building by building.

02

Semiconductor fabs and advanced manufacturing


Construction progress measured against announced schedules. Shell to cleanroom fit-out, utility and abatement buildout, and expansion phases across chip, battery, and EV plants.

03

Power generation and grid interconnection


Substations, transformer yards, turbine and battery storage installs, and the interconnect work that determines whether announced load actually arrives on time.

04

Energy, refining, and storage


LNG trains and terminals, refineries, tank farms, and pipeline infrastructure. Floating roof position, flare activity, and thermal signatures on operating units.

05

Mining, metals, and bulk commodities


Stockpile volumetrics from photogrammetry, pit and haul road progression, tailings and heap leach condition, and load-out activity.

06

Commercial and industrial real estate


Construction progress and as-built verification, roof and envelope condition, and activity signals across industrial parks, logistics campuses, and mixed-use development.

07

Ports, rail, and logistics nodes


Container and trailer counts, yard utilization, intermodal throughput, and terminal congestion at the nodes feeding your supply chain models.

08

Event-driven and catastrophe response


Rapid mobilization after hurricanes, wildfires, floods, and industrial incidents, for damage assessment on assets you hold, lend against, or underwrite.

Built for the mandate, not just the asset

01

Fundamental equity

Test capex claims against physical reality. Verify announced timelines, phase energization, and expansion before it reaches a filing or a guide.

02

Credit and project finance

Construction-stage monitoring on project bonds and private credit. Schedule slippage is the variable that threatens lease commencement and coverage, and it is visible from the air months before it is disclosed.

03

Quantitative and systematic

Consistent cadence, consistent capture geometry, and a structured measurement layer built for panel construction rather than one-off imagery.

04

Private markets and diligence

Pre-close asset verification, as-built confirmation, and condition assessment on sites you cannot walk before you sign.

What lands in your pipeline

  • High-resolution RGB. 2 cm ground sample distance orthomosaic plus full-frame stills, georeferenced.
  • Radiometric thermal. Per-pixel temperature values, not a false-color picture. Analyzed with the RAAD Radiometric Tool so heat differential is a number you can carry into a model.
  • Structured measurement layer. Counts, dimensions, volumetrics, and change versus the prior capture, delivered tabular alongside the imagery.
  • Provenance package. Capture date and time, authorization basis, sensor and altitude, and pilot certification attached to every deliverable.

Delivered in 24 to 72 hours.

Common questions

01

How does this compare to satellite?

Resolution: 2 cm against 30 to 50 cm. Angle: satellite sees roofs, we fly obliques and see elevations, which is where construction progress is legible. Thermal: orbital thermal tells you a site is warm, component-level thermal tells you which units are running and how hard. Scheduling: you pick the date, and we fly under the cloud deck. Satellite screens thousands of sites cheaply. We answer the shortlist. Most of our clients run both.

02

Is flying drones over infrastructure legal?

Yes, when it is done properly, and doing it properly is most of the work. Every flight is conducted by a certified pilot under FAA Part 107 or the local equivalent, from public vantage.

03

Is any of this material non-public information?

All capture is exterior and observational, flown under licensed authorization from publicly navigable airspace. 

04

How consistent is capture from period to period?

Deliberately consistent. Repeat captures fly the same pattern, altitude, and angles, so month over month change reflects the asset rather than the flight. That consistency is what makes a sequence of captures usable as a panel rather than a set of unrelated pictures.

05

Can you fly a site that is not in the Data Center Readiness Index?

Yes. The index is a standing monthly program. The same network will fly any asset you name across 65 countries on the cadence you choose.

06

What happens if a site cannot be flown?

We tell you before the cycle, not after. If airspace, weather, or local restriction prevents a capture, you are notified with the reason, the site is not billed, and we schedule the next window. 

07

How fast can you mobilize for an event?

Depending on thew geography, in 6 - 24 hours. 

08

Do you offer exclusivity?

Both exclusive and non-exclusive structures are available depending on the asset set and term.

Ready when you are

Pick your sites, see the price, and place your order — no quotes, no sales calls.

Order Now