Investment firms use aerial imagery, specifically drones, in two distinct ways. The difference is worth drawing clearly, because it changes what gets bought, how often, and what it is worth.
Tasked aerial capture is low-altitude drone imagery commissioned by a specific buyer, of a specific asset, on a specific date, using a chosen sensor and flight geometry. Unlike satellite imagery, which is collected on a fixed orbital schedule and sold to whoever subscribes, a tasked capture exists because someone asked for it, which is what makes the resulting observation proprietary to the firm that commissioned it. Raad flies these captures at 2 cm ground sample distance in both visible light and radiometric thermal, at oblique angles a nadir-pointing satellite sensor cannot reproduce.
Validation
A thesis already exists. Physical ground truth either supports it or kills it.
This is corroborating a channel check, confirming or dismissing a rumor, or measuring reported results and management guidance against what is actually standing on the site. The desk is not looking for a new idea. It is looking to stop being uncertain about a directional bias it has.
Every input available to a research team carries some discount for the fact that it came from a person. A source can be wrong. A channel check can be stale, or secondhand, or reflect one region and not the others. A management team can be optimistic in ways that are technically defensible. None of that is bad faith, it is just how information behaves when it passes through people, with their own incentives, before it reaches you.
Imagery does not lie. It is a dated, geolocated record of what was physically there when the aircraft flew. That is a different caliber of credibility, and firms are willing to pay for the certainty.
Alpha generation
The harder case, and the more valuable one.
By definition, the whole market has access to rumors, channel checks, filings, press releases, news reports, social media, and sell-side work. Information that everyone holds cannot produce differentiated returns. It gets priced in, and the only edge available is being slightly faster at reading it than the next desk.
Tasked aerial capture is a genuinely proprietary input. You choose which asset gets flown, on which date, from which angles, with which sensor. Nobody else has that observation, because nobody else commissioned it. That makes it something more than a way to check existing ideas. It is an input that generates them: a monthly series on a portfolio of sites surfaces changes nobody thought to ask about, at facilities that are not yet the subject of anyone's rumor.
Most programs start in validation and grow into alpha generation. A desk buys a few captures to settle an internal argument, notices that the recurring series is telling them things they were not looking for, and the site list gets longer.
Verifying Capex Guidance and Construction Progress from the Air
A management team tells the street that phase two breaks ground in Q1 and energizes by year end. That statement is either true or it is optimistic, and the gap between those two possibilities is worth a great deal to whoever resolves it first. The gap is worth more still when bonds due to be refinanced post-tenanting depend on those construction milestones being hit.
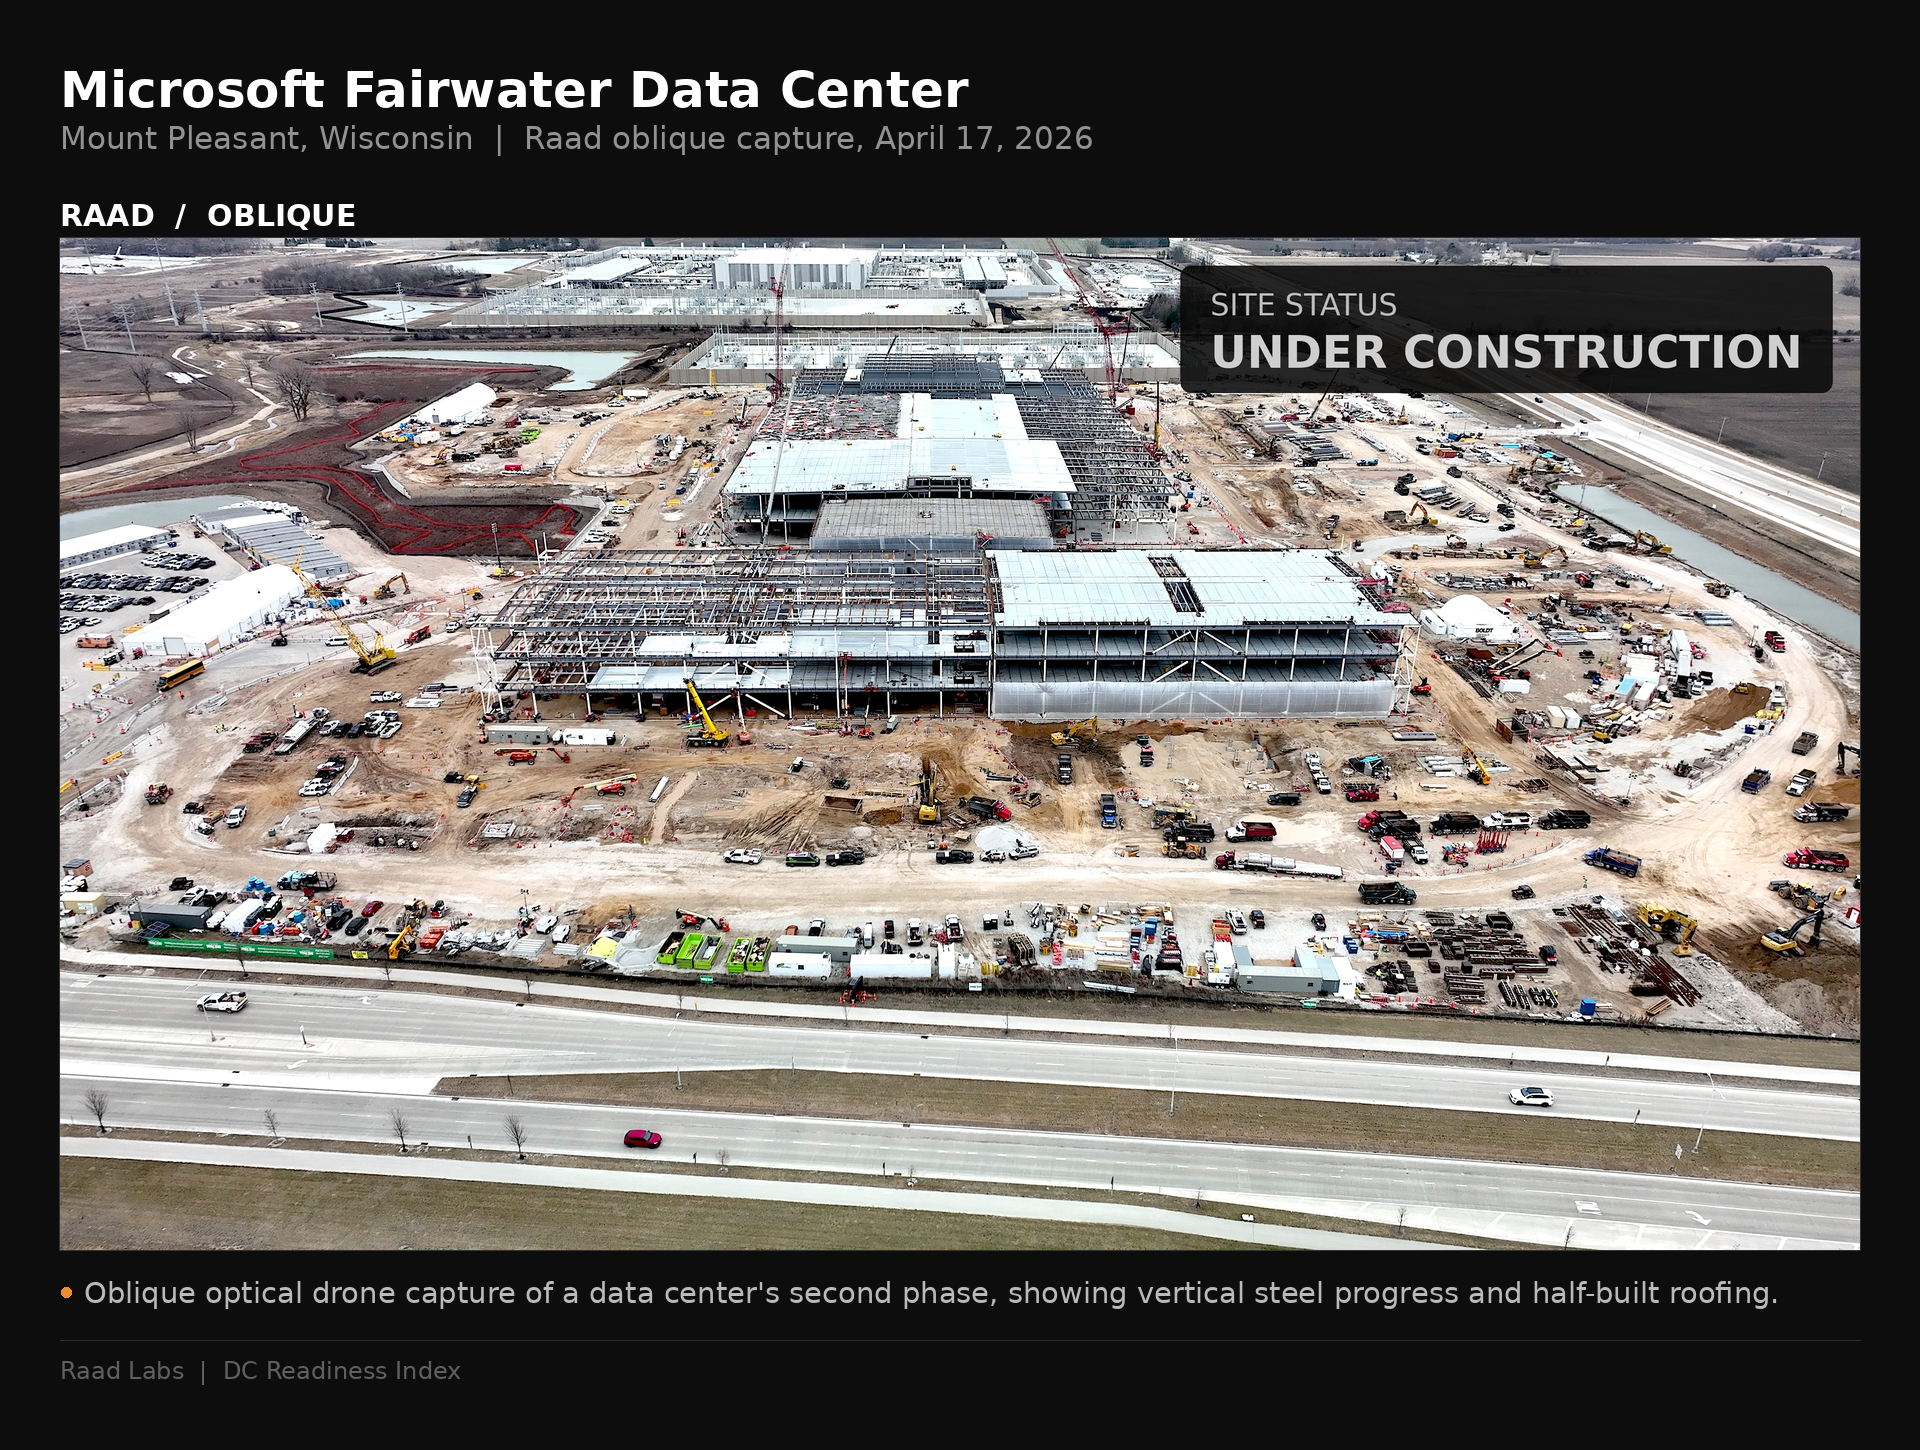
From orbit this is hard, and not for the reason most people assume. The satellite looks straight down. It sees roofs and footprints, and it will tell you a slab was poured. It struggles to tell you whether steel is going up on that slab, whether the generator yard is populated or still bare concrete, whether the switchyard is strung, or how many crews and how much equipment are on site this month against last.
Vertical progress is where construction schedules actually slip, and vertical progress is exactly what a nadir sensor cannot see. That is a geometry problem rather than a resolution problem, which is why buying a sharper satellite does not fix it.
Oblique capture flies the elevation instead of looking down at it. Raad puts an analyst on the side of the building at 2 cm ground sample distance, within a day or two of the desk deciding it needs the look. The question stops being what can be inferred from a footprint and becomes whether what is standing there matches what was said on the call.
A single site answers a single question. A standing portfolio answers the question every month, across every name that matters. That is what the Raad Data Center Index is: monthly RGB and radiometric thermal capture of 83 US AI data centers above 50MW, including crypto-to-AI conversion sites, flown on a consistent schedule and delivered as measurement rather than imagery. Tied to specific tickers and running month over month, it supports positioning ahead of earnings rather than reaction after them.
Thermal Imaging: Verifying Data Center Energization and Utilization
Separating built from running is the one that surprises people, and it is where thermal earns its place.
A finished building and an operating building look nearly identical in visible light, and certainly to a satellite's optical sensor. For a data center, the difference between a commissioned hall sitting idle and a hall carrying load, which is to say generating revenue, is the entire investment question. From the roof it is invisible.
Radiometric thermal imaging records the actual temperature of every pixel in the frame rather than relative brightness, so a chiller, a transformer bank, or a generator can be read as a temperature value instead of a light or dark patch. Raad captures radiometric thermal alongside visible light on every flight in the Data Center Index.
This resolves the question at component level. Chillers, substations, transformer banks, and generators all carry heat signatures that correspond to what they are doing. An energized hall reads differently from one that is commissioned and waiting, which reads differently again from an empty shell with the lights on. Per-pixel temperature turns operational intensity into a measurement rather than an inference, and read month over month it turns into a utilization curve.
Orbital thermal exists but not at useful resolution. It cannot tell you which units are running or how hard, because the unit is smaller than the pixel.
The same logic travels well beyond data centers. A new train at an LNG or refining facility either has capacity online or is still in construction buildout, and those two states carry different thermal signatures long before either surfaces in a volumes disclosure. The same read applies to utility substations and transmission assets, telecom equipment at tower sites, solar arrays and their inverters, and industrial process units under insurance and government monitoring. Anything that converts energy into work announces it as heat first.
Construction Monitoring for Project Debt and Credit Underwriting
Equity desks ask whether a publicly-traded company’s physical footprint conforms with public data or if disappointment or beats are likely to occur. Credit asks a narrower question: will this thing be finished, on time, in a condition that supports the obligation. Whereas data centers used to be funded exclusively with private credit, publicly traded bonds are now being issued to finance construction.
For construction-stage project debt, schedule slippage is the variable that matters, because a delay pushes lease commencement, which pushes the cash flows that service the paper. A borrower is rarely eager to volunteer that news, and by the time it is formally disclosed the market has usually repriced.
Slippage is visible from the air months earlier. Foundations that should be steel. A transformer pad with no transformer on it. An interconnect that has not progressed between two consecutive monthly captures. None of this requires a source inside the project. It requires looking at the same asset from the same angles on a regular schedule and noticing what did not change.
Building a Repeatable Aerial Data Panel for Systematic Strategies
Systematic teams have a different bar. A single dramatic capture is worth almost nothing to them. What they need is a series they can trust, where a difference between March and April reflects the asset rather than the flight.
That means repeat captures fly the same pattern, altitude, and angles every time. It means output arrives as structured measurement (counts, dimensions, volumetrics, change against prior capture) rather than as files someone has to eyeball. And it means missing observations are documented as missing rather than quietly smoothed over, because a silently interpolated gap is worse than an honest hole.
Consistency is unglamorous and it is the entire game for this buyer. Resolution gets the meeting. Panel integrity gets the renewal.
Pre-Acquisition Site Verification for Private Markets
In private markets the use is simpler and more immediate. Before a close, there is a site you have not visited, sometimes in a jurisdiction you have never operated in, and a seller's representation about its condition.
Aerial capture gives you as-built verification, roof and envelope condition, and a dated record of what the asset looked like before you owned it. That last part matters more than people expect. A capture with documented provenance is a baseline you can point at later.
Post-Catastrophe Asset Assessment for Credit and Equity Desks
Hurricanes, wildfires, floods, and industrial incidents create a window where information is scarce and valuable at the same time. Everyone knows a facility or pipeline was in the path. Very few people know what actually happened to it or how quickly crews will bring it back online.
When catastrophe strikes, speed matters, both for credit and equity markets. Tasked capture flies when the airspace reopens, not when the next orbital pass happens to line up with clear skies.
What makes any of this usable
Three things separate aerial data a fund can act on from aerial data that sits in a folder.
Provenance. Institutional buyers underwrite the collection method as closely as they underwrite the data itself. Every Raad capture carries its date and time, the sensor and altitude flown, the authorization basis for that flight, and the certification of the pilot who flew it. That record travels with the file and it is auditable after the fact, which matters because the question does not arrive when you buy the data. It arrives eighteen months later, from compliance, about a position you have already taken. If you cannot answer how the data was obtained, someone else will answer for you.
Legality, assessed per site. Commercial drone operation over infrastructure sits at the intersection of federal aviation rules and a patchwork of state and national statutes, and the analysis genuinely differs site by site. Raad clears every site in advance against that patchwork before a mission is dispatched: airspace authorization, pilot certification, launch and vantage point, and the specific critical infrastructure provisions in force in that jurisdiction. Some sites clear straightforwardly. Some require landowner permission, a different launch point, or an altitude floor. Some do not clear, and those we decline. The clearance basis for each capture is documented alongside the imagery, which is the same reason the provenance record exists: an institution needs to see the work, not be told it happened.
Measurement, not imagery. The deliverable that gets used is the one that arrives with the counting already done. Raad delivers structured output, counts, dimensions, volumetrics, thermal values, and change against the prior capture, in a form a research team can load rather than a folder someone has to eyeball. A single dramatic image is a talking point. A consistent measurement series is a position.
Where satellite still wins
It would be convenient to argue that satellites are obsolete. They are not, and no serious research team believes it.
Satellite screens thousands of sites cheaply and continuously. That is a real job and drones are a terrible tool for it. What a satellite cannot do is answer a specific question about a specific asset on a specific date at component resolution, with obliques and with usable thermal.
The two are not competing for the same budget line because they are not answering the same question. Satellite tells you which of your sites deserve attention this month. Tasked capture tells you what is actually happening at the ones that do. Most of the firms Raad works with run both.
Satellite narrows the universe. Tasked capture resolves the shortlist.
The question worth asking
If you are evaluating this category, the useful exercise is not comparing sensor specs.
For validation, pick the one physical fact that would most change a position you currently hold, and ask whether anything you subscribe to today can actually establish it. If the answer is no, that is where a program starts.
For alpha generation the exercise runs the other way. Pick the assets that matter most to your book and ask what you would notice if you had a dated, consistent look at all of them every month. The answer is usually things nobody has thought to write a rumor about yet.
Both exercises end at the same place, which is a list of sites. That list is the only thing needed to scope a program: which assets, what cadence, which sensors, and what has to be documented for compliance to sign off.
The Raad Data Center Index is that program already running for AI data centers, with 83 US sites above 50MW under monthly RGB and radiometric thermal capture. For portfolios outside that coverage, in LNG and refining, power and utilities, mining, industrials, telecom, solar, or commercial real estate, the same program is built around your site list. Send it over and we will come back with coverage, cadence, and the per-site clearance position.